Execute and monitor an interactive distributed analysis
Users can execute their Dask-based RDataFrame / coffea analysis by running the cells of their notebook or by executing a Python script from the SWAN terminal. As a result, RDataFrame / coffea send tasks to the Dask scheduler, which schedules them on the Dask workers.
The input data for the analysis is expected to be read remotely from the Dask workers, for example from EOS via XRootD, which is supported by both RDataFrame and coffea. Users should not rely on EOS repositories to be mounted on the HTCondor nodes where the Dask workers run, i.e. local EOS paths should not be used in the RDataFrame/coffea analysis code if it is intended to be executed on HTCondor via Dask.
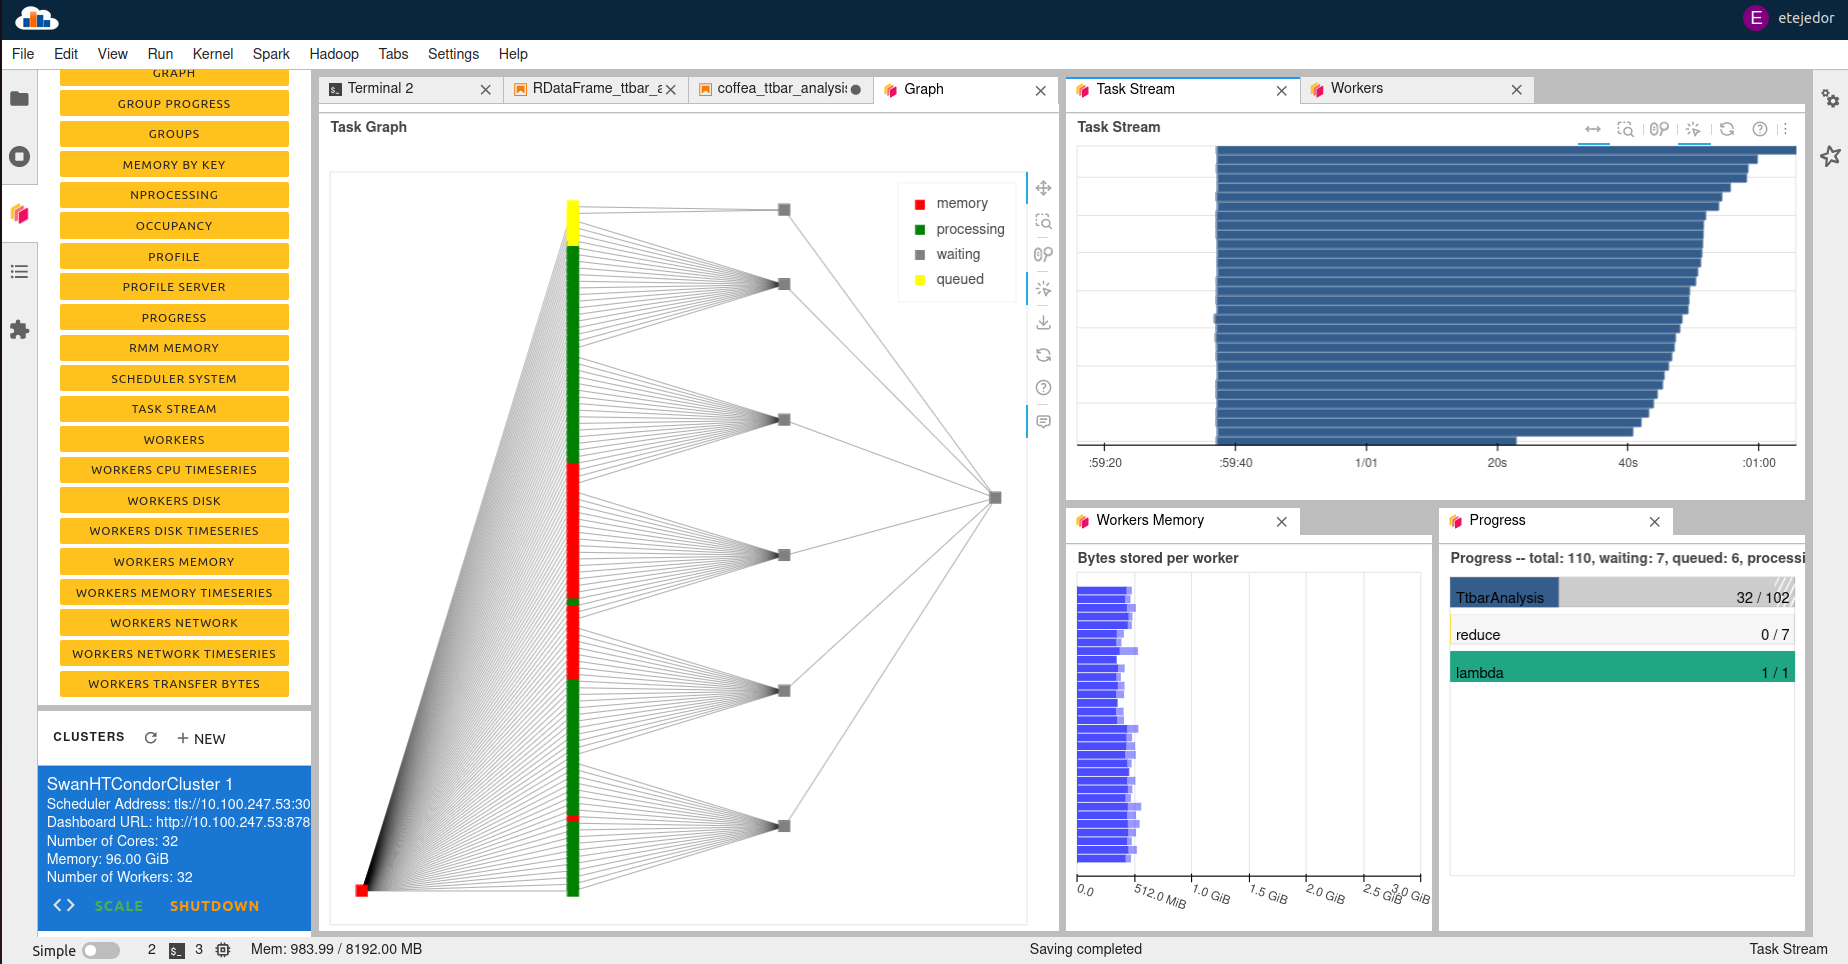
In order to monitor the progress of the distributed execution, the Dask JupyterLab extension provides a dashboard. Multiple tabs with different kinds of information can be opened as part of such a dashboard: task graph that represents the analysis workflow, progress bars for the different task types, task stream that shows an execution trace of the analysis tasks, CPU / memory utilisation in the workers used in the workers, etc. Instructions on how to configure the layout of the Dask dashboard can be found here.
